By Vishweshwar HS, www.showmytrade.com
Technical Analysis in simple terms gives an idea of When to take a stock or other financial instrument at what price, which direction (up or down), for What price target, How much to take the risk (Stop-loss), from available price and traded volume data.
Technical analysis is a method that forecasts the direction of financial market prices through the evaluation of historical prices and, where available volume data.
Charles Dow considered being the father of Technical Analysis, on which the Technical Analysis framework derived. Underlying three assumptions are:
With the hundreds of year’s financial data, Joseph de la Vega – a merchant from Amsterdam, had some elements of technical analysis in the 17th century. In Japan, technical analysis using Candlestick techniques was developed by Homma Munehisa during the early 18th century. In the 19th century, Charles Dow developed Dow Theory is the basis of modern technical analysis.
Many pioneering techniques analyses were contributed by Ralph Nelson Elliott, William Delbert Gann, and Richard Wyckoff, who helped different techniques in the early 20th century.
The advent of computers and software made it possible for more technical tools and theories have been developed and enhanced in recent decades. Technical Analysis can apply in any market worldwide. Technical Analysis can be used and applied to equities, currencies, commodities, bonds, interest rates, and other derivative products.
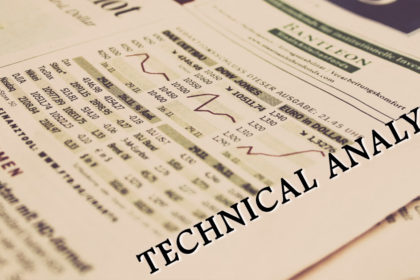
Charts are a graphical representation of price, volume, and time. Technical charts are used worldwide as it is very convenient to apply these data and make the decision to buy and sell the financial instruments.
Using a Technical Analysis chart we can identify — price history, demand & supply, momentum, Indicators, Support & Resistance, Trends, Patterns, Highs & Lows, Time, etc.,
1. Line Charts: We get line charts by connecting the closing price of a stock to the previous closing price of the stock. The line chart use only the closing price of a stock.
2. Bar Charts: A bar chart shows a sequence of vertical bars, the top is high, and the bottom is a low price of the day. The opening price by drawing a small horizontal bar extending out to the left and the closing price shown as a short horizontal bar extending out to the right. The bar chart gives the Open, High, Low & Close price of a stock.
3. Japanese Candlestick Charts: Candlestick uses the same Open, High, Low, and Close data but displays differently. It represented like candles. Candlestick charts may have upper and lower shadows, and body of the candles if the closing price is above open price bullish candle forms. Same way if the opening price is above the close price bearish candle forms.
Researchers across the world developed hundreds of patterns, indicators, and signals for the trading system. Trading systems developed for forecasting and trade on price movements. Indicators focused on identifying the current market trend, support and resistance areas, strength of a trend.
Indicators, charting patterns, trendlines, channels, moving averages, and momentum indicators are commonly used in technical analysis.
Technical Analysis is an essential tool for active traders.
Using various parameters, indicators, support and resistance, channels, trend line, moving averages, etc. one can identify the highly profitable trade with accepted risk. Highly recommended to learn the art and science of technical analysis.
What is Trend and How to Use it make money from the Stock Market?
What are Buy Today and Sell Tomorrow & Sell Today Buy Tomorrow Trading?
What is Intraday or Day Trading?
Kindly share your comments on the “What is Technical Analysis?” below. Any suggestions regarding this article will update in the next edition.
Thanks for reading.
Good Earning!